skip to main
|
skip to sidebar
Matt's Map Catalog
Monday, August 4, 2008
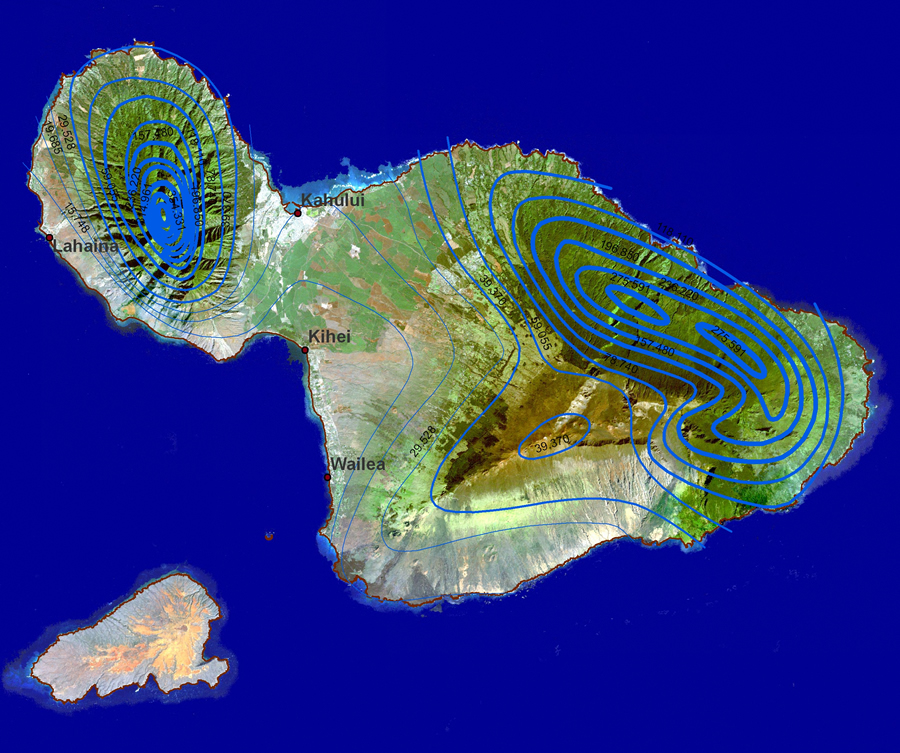
Isoline maps
Isolines connect points of the same value on a map, it is commonly used to show elevation, as well as almost any other variable. This map was created with ERSI software and shows the rainfall differences on the island of Maui in Hawaii.
http://www.esri.com/news/arcwatch/0207/graphics/feature1-lg.jpg
1 comment:
Anonymous said...
Hello
August 4, 2008 at 1:26 PM
Post a Comment
Newer Post
Older Post
Home
Subscribe to:
Post Comments (Atom)
Blog Archive
▼
2008
(51)
▼
August
(47)
Star plots
Correlation matrix
Similarity matrix
Stem and leaf plot
Box plot
Histogram
Parallel coordinate graph
Triangular plot
Windrose
Climograph
Population profile
Scatterplot
Index value plot
Lorenz curve
Bilateral graph
Standardized choropleth maps
Univariate choropleth maps
Bivariate choropleth maps
Unclassed choropleth maps
Classed choropleth maps
Range graded proportional circle map
Continuously variable proportional circle map
DOQQ
DEM
Digital Line Graph
Digital Raster Graphics
Isopach
Isohyets
Isotachs
Isobars
LIDAR
Doppler radar
Black and white aerial photo
Infrared aerial photo
Cartographic animations
Statistical Maps
Cartograms
Flow maps
Isoline maps
Proportional circle maps
Choropleth maps
Dot distribution maps
Propaganda maps
Hypsometric maps
PLSS maps
Cadastral maps
Thermatic Maps
►
June
(4)
About Me
mhl06
View my complete profile


1 comment:
Hello
Post a Comment